Overview
Gnarles here. Sweatband on. Headphones cinched.
You used to cut to the music the same way you parallel park — squinting, leaning, hoping the lines were where you thought they were. You dragged the playhead to the snare. You nudged a frame. You nudged it back. The track was a wall of mush in the timeline lane and the snare was somewhere in there.
We built the audio side of VibeChopper to let you see sound. The mixer panel showed every track at once. The VU meters showed which one was about to clip. The waveform preview drew every clip's actual shape. The beat-detector laid magenta markers on the timeline where the music was actually hitting. You stopped guessing. You started landing.
This is the post about the audio part of the edit you can finally look at.
---
1. The "Cut On the Beat" Eyeball
The traditional cut-on-the-beat workflow was a workout your eyes weren't trained for. Pull the music in. Zoom the waveform. Scrub. Guess which peak was the downbeat. Drop a cut. Notice it was three frames late. Nudge. Nudge back. Ship a cut that was fine.
Three frames late is the death of a beat-cut. Your audience didn't catalog the failure — they felt the energy stall. The cut was supposed to land on the kick. Instead it landed on the breath right after.
The eyeball wasn't the problem. The tool was. You can only zoom a waveform so far before the bars stop telling you anything new — and the first perceptible point of a transient lives a few milliseconds before the visual peak anyway. Eyeballing was always a proxy.
We replaced the proxy with the real thing. Three pieces of glass. One algorithm.
---
2. Audio Mixer — Multi-Track With VU Meters, Faders, Pan, Mute, Solo
The mixer was front of house. It sat right there in the editor — header, channel strips, VU meters lit, faders ready.
Each track got a channel strip with the same five controls a real desk has:
- Volume fader. Vertical slider. You held it with one finger; you watched the meter to the right of it move.
- Pan knob. Center by default. Pull it left for room tone. Pull it right for an SFX cue you wanted to feel off-camera.
- Mute. One click. The signal stopped feeding the bus. Other tracks kept going.
- Solo. Everything else dropped. Just that channel, alone, exposed.
- A live VU meter. Always on, always drawing, telling you what the signal was actually doing at the bus.
The mixer pulled track configuration from a mix-config query off the project — track name, track type, default volume, pan, muted, solo — and rendered a strip per track. Move a fader, it called straight into the Web Audio playback hook. Toggle mute on "FX BUS", the FX bus stopped. The signal flow you saw on the screen was the signal flow your speakers heard.
The meter update loop ran in a requestAnimationFrame cycle. Every paint, every track's level got read from the audio graph and drawn. On a 120Hz panel, your meters refreshed 120 times a second. The motion read as continuous because it was continuous, frame-locked to your display.
You sat down. You hit play. The faders were where you left them. The meters lit up. You moved a fader half a hair. You heard the change. You watched the meter dip. You moved on.
---
3. VU Meters — Calibrated, Not Decorative
There are two kinds of VU meters in software. One is a moving green bar that decorates the panel. The other is a calibrated reading that tells you whether you're about to blow out the bus. Ours was the second.
Each meter took a normalized 0-to-1 audio level. The drawing code converted it to decibels (20 * log10(level)), then mapped that onto a sixty-decibel range from −60 dB at the floor to 0 dB at the ceiling. Twenty segments stacked vertically (or thirty horizontally). The color coding was unambiguous:
- Green below about −9 dB. Safe.
- Orange from about −9 dB to about −2 dB. Warning. Your signal was getting hot.
- Red from about −2 dB to 0 dB. Clipping zone. Back off the fader.
The meter held a peak indicator for 1.5 seconds. When the signal hit a new high, a white tick locked at that height, then decayed at about five percent per refresh until the signal touched it again. The same trick a hardware meter does — except you didn't have to crane your neck to read it. The tick sat right where your eyes already were.
This is why your mix stopped clipping. You didn't intuit "this is loud." You saw the red segment light up. You pulled the fader. The peak indicator settled into orange. The bus didn't pin. The export didn't distort.
---
4. Waveforms — What a Real Waveform Tells You
The mixer was front of house. The waveform was the X-ray. Cut on the beat free
Every audio clip got a WaveformPreview — vertical bars mirrored top and bottom around a center axis, sixty-four bars by default. The drawing code fetched the audio from object storage, ran it through the Web Audio API's decodeAudioData, walked the first channel, and recorded the peak absolute amplitude inside each of sixty-four equal-width buckets. It normalized so the loudest bucket read at full height. Then it drew.
You saw the shape of the clip. Not a generic blob — the actual envelope of that recording. A breath read as a thin bar. A word read as a tall bar. A laugh read as a spike. A long ambient passage read as a low even ripple.
Things you could see at a glance:
- Dead air. A long flat stretch at the start meant silence before the line started. You trimmed it. Cold opens got crisper.
- The transient. The first tall bar of a word told you where the consonant landed. You snapped the clip start to that bar. The line started on contact.
- A pop or thump. A single tall isolated bar inside an otherwise quiet stretch was a mic bump. You cut, deleted the offending frames, kept moving.
- Mix balance. Your VO bars versus the music bed's bars, both visible on adjacent tracks, told you instantly whether the bed was masking the dialogue.
The component cached peaks per source URL — the second time you scrubbed to a clip, the waveform was already drawn. While decoding, the preview showed "Analyzing audio…" so you knew it wasn't broken, just thinking.
You weren't reading a chart. You were reading the sound of your edit.
::
---
5. Onset / Beat Detection — Markers, Not Guesses
Now the part you came here for. Open the mixer
The beat-detector ran server-side. It pulled the audio out of object storage, ran it through ffmpeg to extract raw mono PCM at 22,050 Hz, and handed the float-32 samples to an energy-based onset detector. Two passes.
Pass one — energy frames. It walked the samples with a 25-millisecond window and a 10-millisecond hop. For each window it computed the root-mean-square energy — the loudness of that slice. That gave it a per-frame energy curve, one reading every ten milliseconds.
Pass two — spectral-flux-lite and adaptive peak-picking. It took the positive differences in energy from one frame to the next — only increases, because beats are attacks. Then it scanned for peaks where the flux was at least 1.5 times the local mean over the previous forty frames and the flux was a true local maximum and at least 180 milliseconds had passed since the last beat. That 180-millisecond floor caps the algorithm at roughly 333 BPM — well past any tempo you'd cut to.
The output: a list of beat timestamps in source-audio time, a BPM estimate from the median inter-beat interval (60 divided by the median gap, rounded), and the duration.
This is not a beat tracker that guesses meter or finds the downbeat. It's an onset detector with adaptive thresholding — a workhorse for snapping cuts to where the music actually has a transient. One job, well.
The integration: the Fit to Beat clip-context-menu action called this detector. It took your clip's source-start time, found the nearest detected beat, and — if that beat was within half a second — shifted the clip's timeline startTime by the same delta so the first sample lined up with the beat. Farther than 500ms, the clip didn't move. The action reported back with previous start time, new start time, BPM, beats found, and whether it actually snapped. A quiet "snapped to beat at 92 BPM, 64 beats detected," or an honest "no nearby beat — clip not moved." No false confidence.
Three days of nudging became one menu click.
::
---
6. Audio Normalization — Your VO Stopped Blowing Out the Bed
The last piece was loudness. You cut a 60-second piece. VO recorded at one studio level. Music bed from a different source. B-roll with embedded camera audio at a third level. The export sounded uneven.
VibeChopper ran an audio analysis pass per clip. The analyzer estimated four numbers: integrated loudness in LUFS, peak amplitude in dB, dynamic range, and a clipping flag (true if peaks exceeded −0.5 dB). It returned a suggested gain in dB to land the clip at −14 LUFS — the loudness Spotify and YouTube normalize to. (Spotify Loudness Normalization, YouTube's −14 LUFS target.)
Two flavors:
- Per-clip normalize lifted or attenuated a single clip to hit −14 LUFS.
gain = target − current, clamped to ±20 dB, converted from decibels to a linear multiplier. The clip'saudioVolumeupdated. The VU meter on that channel settled at a healthier midpoint. - Smart-normalize-project ran the analysis across every audio clip, computed the average integrated LUFS, clamped the target into a sane window (−20 to −10 LUFS), and brought every clip toward that shared target. Muted clips got skipped. Failed clips got reported back individually.
Your VO stopped jumping ten dB between clips. Your music bed stopped masking dialogue. Your export came out as a mix the audience could just listen to, instead of one they had to ride the volume knob through.
Loudness used to be a finishing pass in another tool. Now it was a button in the same panel — and you watched the result on the same VU meters that were already lit.
---
7. Walkthrough — Three Cuts To a Generated Bed
One real flow. Reps in, reps out.
You generated a 92-second felt-piano bed at 72 BPM from the chat (the companion post walks the music side). The bed landed on a "Generated Music Bed" track at volume 0.32 with a 1.2-second fade in and a 2-second fade out.
Rep 1 — Open the mixer. Four channel strips lit up: VO, music bed, room tone, FX bus. The VU meters drew live as the playhead rolled.
Rep 2 — Look at the waveform. You scrolled to the second verse. The waveform preview drew sixty-four magenta bars. The third bar from the verse start was taller than its neighbors — a piano transient where the felt hammer hit hardest. That was beat one of the bar you wanted to cut on.
Rep 3 — Fit to Beat. You right-clicked the wide shot you wanted to land on that transient and chose Fit to Beat. The action found 64 beats at an estimated 72 BPM, snapped the clip's start time by 0.18 seconds. The first frame of the wide shot landed on the piano transient. You played it. It hit.
Rep 4 — Two more cuts. You walked the playhead to the next pivot — the bed thickening into a low ostinato. Fit to Beat snapped the next clip 0.07 seconds. The one after, 0.21 seconds. Three cuts. Three beat-locked landings. No nudging.
Rep 5 — Normalize. Smart-normalize-project walked every audio clip, computed the average LUFS, picked a target in the safe window, and brought every clip into the same loudness room. Your VO stopped diving and lifting. The mix sat down.
Rep 6 — Watch the meters. You played the whole 60 seconds. The VU meters lit green, occasionally orange, never red. Peak-hold ticks bumped to the orange band at the loudest moment and decayed back. The export was going to come out the way you heard it in the panel.
Time spent on audio for this edit: as long as it took to read this section. Time spent six months ago: another Saturday. Sets and reps. The deck is warm.
---
See You On the Timeline
Sound used to be the part of the edit you couldn't quite see. You could hear it. You could feel when it was wrong. You couldn't always tell where it was wrong without scrubbing the lane half a dozen times.
The mixer let you see the levels. The VU meters let you see the peaks. The waveform let you see the shape. The beat detector let you see the hits. Normalization let you hear every clip in the same room.
To start from the music side and work outward, read Score Your Edit With AI-Composed Music — that's how a custom Lyria bed lands on a tagged track with the beat-detector running before you even open the mixer. For the narration side of the same panel, pair it with AI Voiceover Without Hiring Anyone — same mixer, same VU meters, same waveform, different signal.
You shot it. You scored it. Now you can see every wave of it.
See you on the timeline.
— Gnarles
A neon equalizer pulsing into a chrome heartbeat that lays glowing magenta beat-markers across a filmstrip
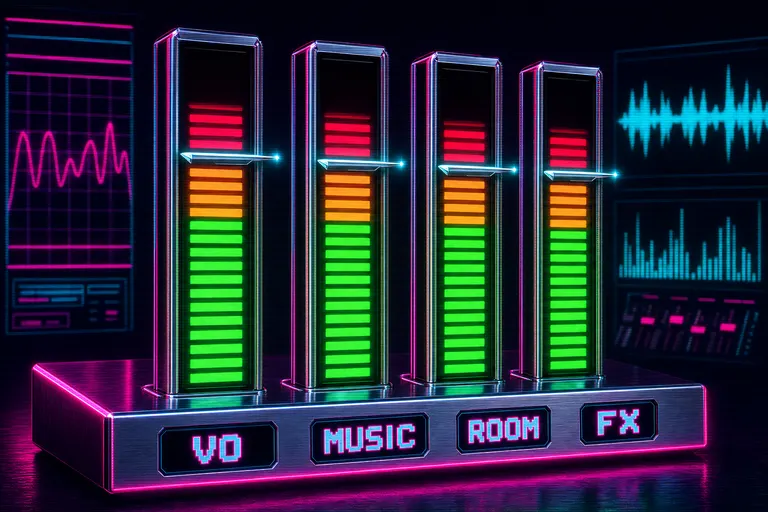
A stack of vertical VU meter columns glowing green, orange, and red, with a chrome peak-hold needle hovering near the top
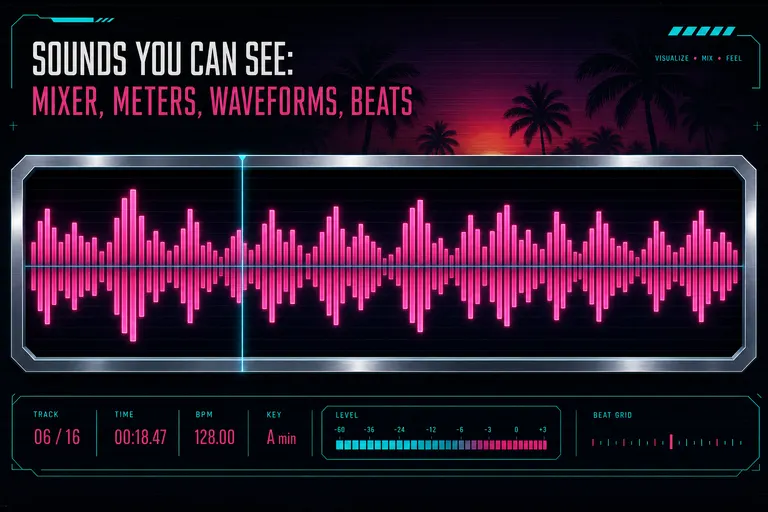
A horizontal row of magenta waveform bars varying in height, drawn against a chrome trough on a deep VHS-black panel
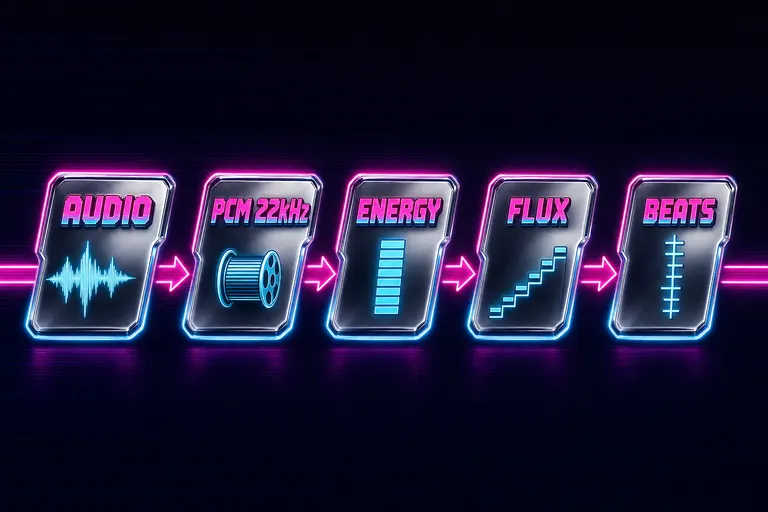
Diagram: audio file to ffmpeg PCM to energy frames to spectral flux to beat markers, five chrome plaques connected by neon arrows
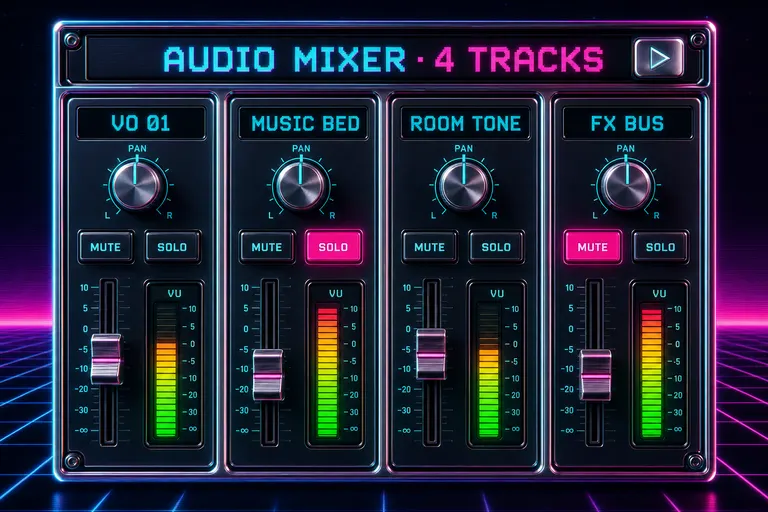
Stylized synthwave mock of the VibeChopper audio mixer showing four channel strips with faders, pan knobs, mute and solo buttons, and lit VU meters
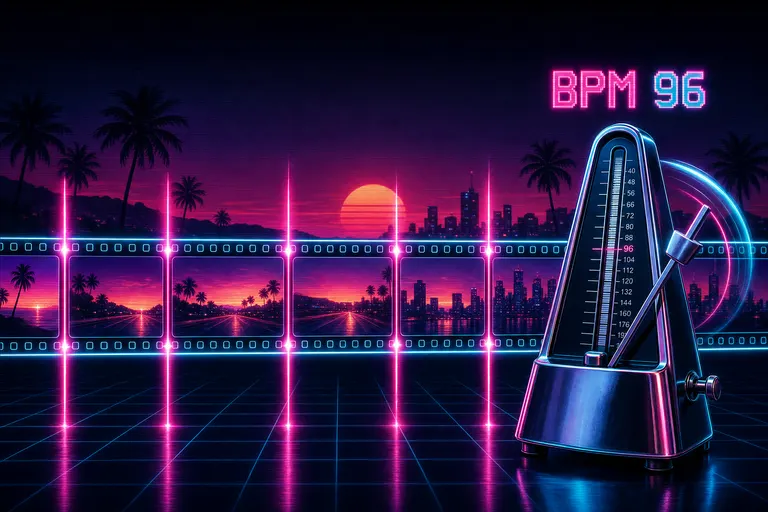
Vertical magenta beat-markers piercing a horizontal filmstrip, each marker aligned to a frame, with a chrome metronome standing beside the strip
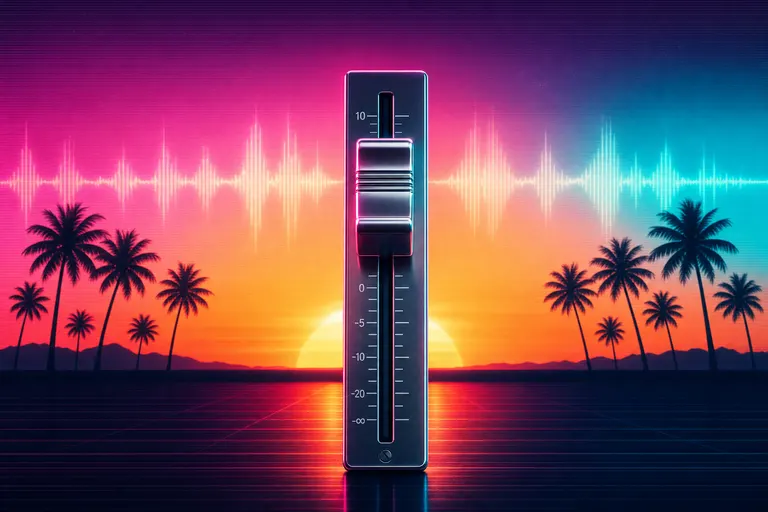
A chrome fader at the foot of a sunrise horizon, gently pushed to the perfect mix position, with palm-tree silhouettes and a faint waveform ripple across the sky
Try the workflow
Open every feature from this post in the editor
These panels collect the features discussed above. Sign in once, finish your profile if needed, then the editor opens the first highlighted surface and walks through the tutorial.
Step 1
Cut on the beat
Open the mixer, let VibeChopper drop beat markers on your timeline, and snap your cuts to where the music actually hits.
Cut on the beat free →Step 2
Open the mixer
Multi-track faders, pan, mute, solo, VU meters, waveform previews — all in the editor, one panel away.
Open the mixer →